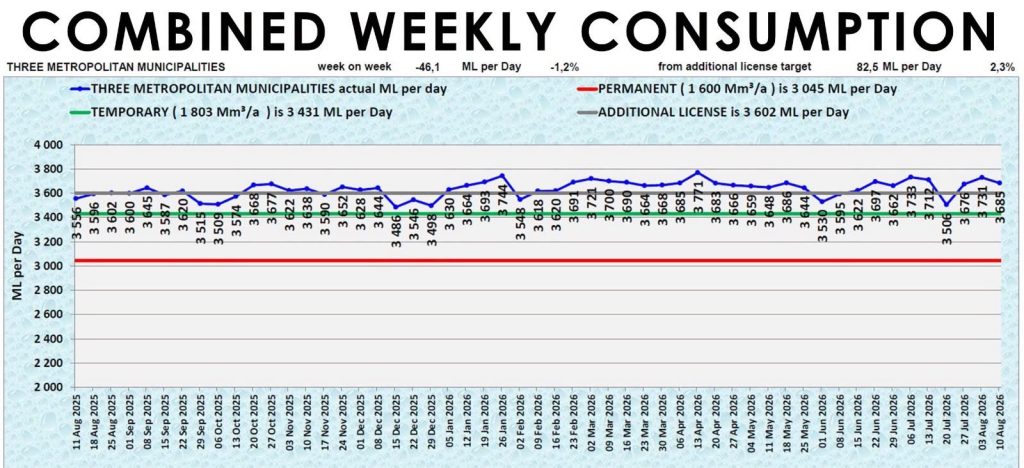
Rand Water published its famous graphs depicting consumption patterns of three Metros in Gauteng, on Thursday.
The Red line in the graph represents Rand Water’s consumption agreement with the Metro.
The Blue one shows the consumption patterns/trends of the Metros.
When the Blue line falls the Red, it means the Metro is consuming more water than agreed upon with Rand Water.
Thursday’s graphs show the Cities of Johannesburg and Tshwane, are using more water.
This is while Johannesburg Water (JW) reported progress in the Commando system, which is now supplying water satisfactory, after a difficult week marked by breakdowns and disruptive mechanical and electrical events.
Affected areas are Westdene, Auckland Park, Melville, Emmarentia and Parktown West.
JW said it continues to monitor and validate flows to parts of the system.